Iowa congressional district maps, 1847-2032
Or: Will the last person to leave rural Iowa please disconnect the yard light?
| 1 | 2 | 3 | 4 | 5 | 6 | 7 | 8 | 9 | 10 | 11 |
| 1847 | 1847 | 1862 | 1862 | 1862- 2012 | 1862- 1992 | 1872- 1972 | 1872- 1962 | 1872- 1942 | 1882- 1932 | 1882- 1932 |
Districts are calculated based on the census in the x0 year of a decade. They are finalized either in the x1 (1931 and later) or x2 year (1800s) for the election in the x2, and representatives take office in January of the x3 year of that decade.

1847 (first districts of statehood)
From the 1963 Iowa Official Register: "Iowa's first two congressmen, who took their seats December 29, 1846, were elected from the state at large. Two congressional districts were created February 22, 1847, and the state continued with two districts through eight sessions, a period of 16 years."
Poweshiek moved to District 1 in 1848; Des Moines, Louisa, and Washington moved to District 1 in 1857. Then same until election of 1862.
The 1963 Iowa Official Register gives the following dates for the previous 80 years of redistricting: Jan. 24, 1848; Jan. 28, 1857; April 8, 1862; April 17, 1862; March 23, 1882; April 10, 1886; April 10, 1931; April 15, 1941; May 3, 1961. (p. 381-384)
1862 - 674,913 - 112,486 per district
Population figures here and below are of decennial censuses.
1872 - 1,194,020 - 132,669 per district
1882 - 1,624,615 - 147,692 per district
This is the map under which "Tama Jim" Wilson was elected in 1882 and 1884 for the 5th District.
1886 - 1,753,980 - 159,453 per district*
*"The 1886 redistricting was based on the 1880 federal census, but state maps displayed the 1885 state census figures. Purposes of the 1886 map were avowedly political." (Iowa Official Register, 1963-64)
The 1886 districts were used up to and including the elections of 1930. Per-district numbers below are simply the population divided by 11; there was a significant imbalance in representation among districts near the end.
1890 census - 1,912,297 - 173,845 per district
1900 census - 2,231,853 - 202,896 per district
1910 census - 2,224,771 - 202,252 per district
1920 census - 2,404,021 - 218,547 per district
The size of the U.S. House was fixed at 433 in 1910, which became 435 in 1912. It's been a zero-sum game since - and Iowa's been on the losing end. The midterm election of 1910 was the last time Iowans elected more representatives than Californians; the number for each stayed at 11 until 1932.
1931 - 2,470,939 - 274,549 per district
1941 - 2,538,268 - 317,284 per district
1950 census - 2,621,073 - 327,634 per district
1961 - 2,757,537 - 393,934 per district
The four-county district encompassing Des Moines, Ames, and Fort Dodge is the smallest district ever created in the state.
1971 - 2,825,368 - 470,895 per district
1981 - 2,913,808 - 485,635 per district
Beginning with the 1981 redistricting, a nonpartisan commission was established to create Iowa's lines with no regard for history or incumbency. It's the system closest to the ideal of equal representation in Congress in the nation. The Legislature is allowed to vote on up to three plans, after which it's up to the Supreme Court to make one. For a case of redistricting gone mad, compare directly across the Mississippi, where Illinois District 17 (PDF) made "Top gerrymandered districts" lists in the 2000s.
1991 - 2,776,831 - 555,366 per district
The election of 1992 was the first time Iowans picked fewer than six representatives since 1860, the same year they voted for Abraham Lincoln. This was also the first time ever that the southeast cluster was not in District 1.
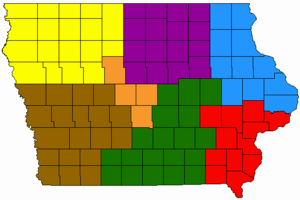
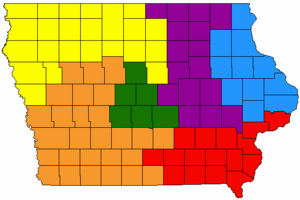
2001 - 2,926,324 - 585,265 per district
This is only the third time that Polk and Dallas counties have been separated. Unfortunately, it was the first time that distinction mattered. In the mid-1990s, the western suburbs crossed the county line and began to eat into the southeastern corner of Dallas County. While District 4 stretches from New Albin to New Virginia, its population is heavily concentrated in the southern part, giving Des Moines a quasi-second representative. This would not have been a problem in the original proposal, which the Legislature rejected.
According to a list from the Census website, District 5 was the 431st seat allocated. Throughout the decade, most Iowans figured it was going to get worse - and it did.
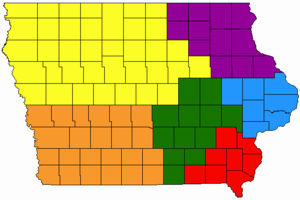
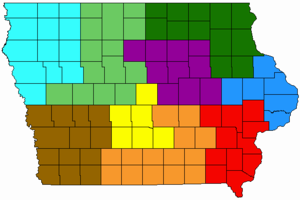
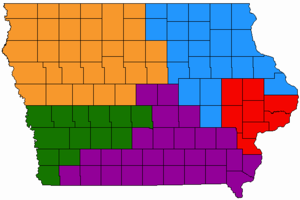
2011 - 3,046,355 - 761,589 per district
The news that the state finally - finally - cracked 3 million was far overshadowed by the loss of a House seat. Based on numbers in the initial apportionment list released in December 2010, the number of people per district in Iowa is the third-largest of any state with two or more districts, behind Idaho and Oregon. Meanwhile, Minnesota, which held onto its eighth seat by the skin of its teeth after being handed No. 435, averages about 100,000 fewer people per district. That's still more than Nebraska, with 608,780 per seat - a number low enough that if that were the baseline, Iowa would've kept District 5. (Note: Numbers here are military-overseas-excluded, explaining the slight discrepancy in the header vs. the linked page.)
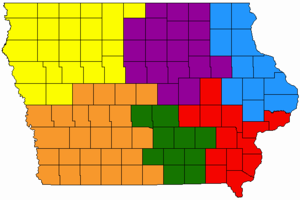
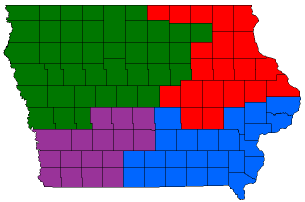
The first, and approved, version - which, if you look at it with thick lines instead of colors, resembles a pinwheel - roughly divided the state into quadrants. (The big winner: Every TV market.) By circumstance and necessity (only four districts, what can you do?), it also created some historic divisions and unifications:
- Black Hawk and Butler have been separated for the first time in history.
- Harrison, Shelby, and Audubon aren't with Pottawattamie and Cass for the first time in history.
- Mitchell and Worth have been separated from Chickasaw and Floyd for the first time in history.
- Black Hawk and Linn are together for the first time since the beginning of the Civil War.
- Grundy County is in "northwest" Iowa for the first time since Ulysses S. Grant's first term.
- Story and Woodbury are together for the first time since the midterm election of 1880.
- Tama and Linn are together for the first time since the beginning of the Great Depression.
- In the 1990s and 2000s, lines between the state House, state Senate, and U.S. House never crossed: Each congressional district had 20 House districts and 10 Senate districts. Now, each congressional district has 25 House districts...and 12½ Senate districts. New Senate 15 (most of Jasper, eastern Polk) and Senate 26 (Worth, Mitchell, Howard, Chickasaw, Floyd, and eastern Cerro Gordo) are the border jumpers.
One more stat set: In 1980, Iowa had about 200,000 more people than Arizona. If Iowa had Arizona's growth rate since then, the 2010 count would have been approximately 6.85 million people and nine seats. If you consider that unfair because Arizona's growth rate has been insane, if Iowa had merely kept up with the U.S. average it would be 3.97 million and either five or six seats.
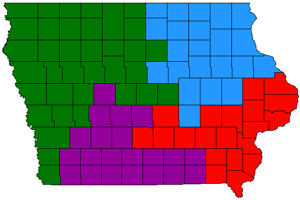
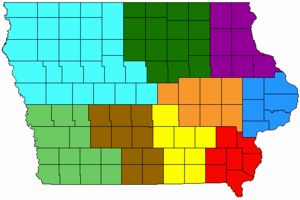
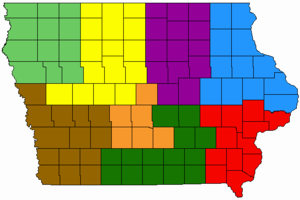
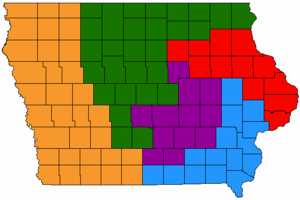
2021 - 3,192,406 - 798,102 per district
The colors look a little different on this map because of a computer change, but the flip of the 1st and 2nd districts is real. I believe the LSA's numbering rule is something like "east to west by geographic center of each district". It can't be just the easternmost, because then whichever district had Clinton County would always be the first. The number of people per district in Iowa is the fourth-largest of any state with two or more districts. Minnesota's 8th District was literally the last seat allocated, by 26 people.
This was the LSA's second map; the first put Linn and Johnson together and was rejected. The Senate district-jumpers this time around are districts 24 (mostly Greene/Guthrie/Boone) and 33 (Jones/Jackson/Dubuque).
Iowa's representatives, 1997-2007
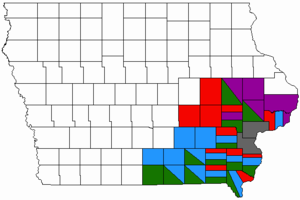
Jim Leach
As Iowa's longest-serving congressman (until the election of 2006), Leach has represented a good chunk of east-central and southeast Iowa. Red indicates counties in his district prior to 1983, blue is for 1983-1993, purple is for 1993-2003, and green is 2003-2007. Louisa and Muscatine have always been in his district, which was always the 1st until 2003. (Leach moved from Davenport to Iowa City after the 2001 redistricting put him and Jim Nussle in the same area.)
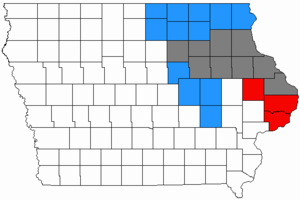
Jim Nussle
Nussle served one term before beating Rep. Dave Nagle when Iowa lost a district for the 1992 election. This map shows his post-1993 districts, while he served the 2nd District (blue) in 1993-2003 and the 1st District (red) 2003-2007; the overlap is in gray. Not marked is the 1981 arrangement, which included Linn and Cedar in addition to counties he served either in the 1990s or 2000s. He ran for governor in 2006 and lost.
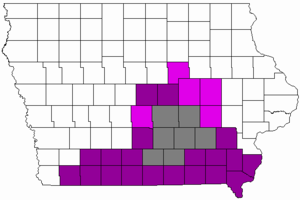
Leonard Boswell
Boswell moved from Davis City to Des Moines in order to keep his spot in the 3rd District. Dark purple counties were his between 1997 and 2003; pinkish after 2003, and gray for both. After his election, Iowa kept four out of five representatives for 10 years, changing only in 2002, when Greg Ganske ran for Senate against Tom Harkin and Steve King took the new 5th district that encompassed the western third of the state.
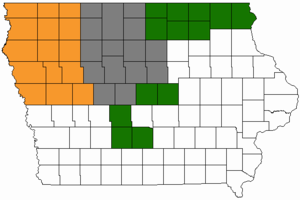
Tom Latham
Latham entered Congress one election before Boswell (and with Leach's defeat, becomes Iowa's longest-serving House member). He served in the 5th District in the 1990s (orange), and then his focus shifted to northeast Iowa and counties surrounding Des Moines (4th District, green). Gray counties are the overlap.
Sources: The Historical Atlas of United States Congressional Districts, 1789-1983; The Des Moines Register, 8/13/81; Iowa Legislature website; thegreenpapers.com
Page created 5/6/05; last updated 4/29/11 5/10/21 8/12/22