Normally, at this time of a year ending in 1, the Legislative Services Agency would be hard at work carrying out the nation’s best mapping exercise. This will be the fifth time the LSA has drawn up boundaries for Iowa’s congressional and legislative districts.
It’s not a normal year. It’s so abnormal, in fact, that it’s running headlong into constitutional stipulations that demand creation of districts on a timetable that cannot be met.
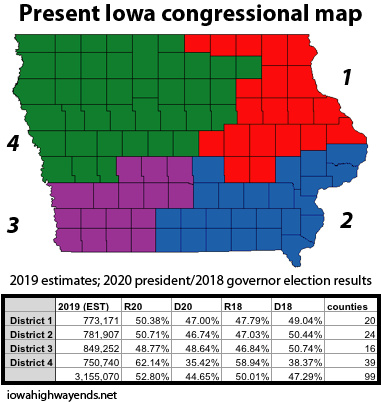
To fill the gap, I played a “redistricting game” similar to the one I did for the Register in 2011, using 2019 census estimates issued last year. Ironically, because of the delay in tabulation, we’ll get July 2020 estimates (May 4) before the April 2020 actuals (TBA).

Unlike 2011, though, I did this entirely manually. Things to keep in mind:
- The LSA will have more up-to-date numbers and more powerful tools. I’m just a map geek with a spreadsheet.
- Iowa’s redistricting rules factor in district perimeter length. I cannot be that fancy, but I can say “Does this look like a map the LSA would plausibly create?”
- It is surprisingly difficult to get raw data of general election totals. The files at the secretary of state’s website are PDFs. They can be converted, but there are also multiple subcategories I don’t want. Viewing results is easy, downloading datasets is hard.
- Staring at this list emphasizes how absurdly county names are tilted toward the first half of the alphabet.
- I have to use a spreadsheet program that acts differently from Numbers ’09 and can be downright aggravating at times.
- Iowa does not have any counties with a population between 52,000 (Warren) and 92,000 (Pottawattamie).
- Polk and Dallas counties, kept together, were nearly 2/3 of a district in 2010 but nearly 3/4 in 2019. Adding 93,000 people will do that — and that number will get them three more state House seats alone.
- If Iowa still had six congressional districts, logistically it would be nearly impossible to maintain whole-county units. Polk County alone would be 93% of a district. The law would have to be rewritten.
- Palo Alto County had precisely 5,000 votes cast in the 2020 general election.
- This academic exercise in no way prevents me from mocking (heh) people who churn out mock drafts for weeks on end.
Armed with two things that can provide hours of entertainment — maps and finite data sets — I set out to create potential Iowa congressional districts for the 2020s. Then I inadvertently created Ashley Hinson’s worst nightmare.
(In retrospect, I should have kept a lighter color in my top four color-coded congressional districts. Oh well. Also, this blue should match my previous blues, but does not.)

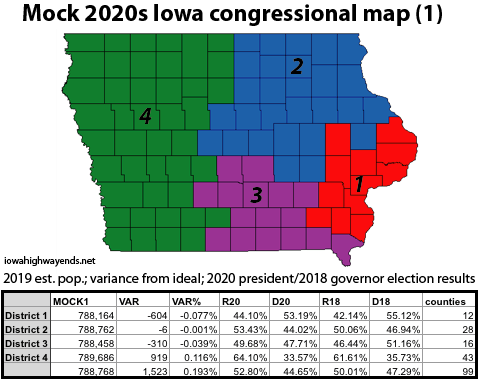
Mock 1
District 1: Hinson’s home Linn County is plucked from northeast Iowa and lumped in with more populous — and Democratic — counties to the east and south. This district keeps Linn and Johnson together, which some people find valuable.
District 2: This is what John Deeth would call a “My District Just Not My House” situation. All but two counties of the current 1st (Linn/Jackson) are in this new 2nd. The 2019 population of this set is off from the ideal number by six! The LSA’s 2011 map’s districts varied by a few dozen. The catch is that my others vary by a few hundred. This district includes a lot of Obama-Trump counties and would be an open seat (unless Hinson moves to Anamosa).
District 3: Iowa’s process forbids consideration of current elected officials or party identification, which means only Iowa would give us this treat: Incumbent-on-incumbent violence in an extremely competitive district!
District 4: The weakness of this map is that it splits Polk and Dallas counties, which I dislike but as noted above takes some work to avoid. Dallas alone has one-ninth of this district’s population, and in the time it will take you to read this blog post someone has probably moved to Waukee.
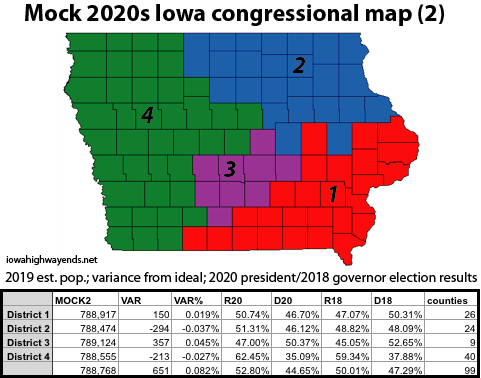
For my next map, I started out with the intent of keeping Polk and Dallas counties together.

Mock 2
District 1: It took adding 15 counties to replace losing Linn here. The shape is like an enlarged version of the 2000s 2nd District. Every current congressperson gets to stay in place.
District 2: This overlaps a lot of the present 1st, including Cedar Rapids, Waterloo, and Dubuque while adding the Mason City TV market.
District 3: Pretty compact and keeps the Des Moines metro area unified.
District 4: Much of the 2000s 5th District plus the central chunk of the 2000s 4th. Story County, and possibly Woodbury, could be the only blue one(s) here in every state-level election for a decade.
I may make a third map and/or update the numbers when the 2020 estimates come out.
