
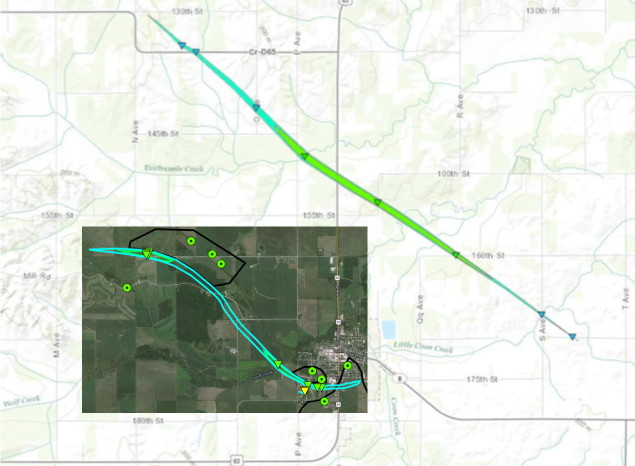
I know it doesn’t look great, but the NWS used two mapping services and I had to play with sizing. The slightly darker black line running north-south and then along the bottom left of the map is US 63. The blue bounds mark each tornado’s path with EF0-scale winds. The light green is for EF1 damage. The EF2 damage area in the southwest corner of Traer cannot be seen on this scale, only by the yellow triangle. The July 6 tornado was much longer, but left much less damage.
Bottom line, two tornadoes spawned within miles of each other a week apart, and Traer has a big item for the 2023 sesquicentennial book.
Report for June 30 (HTML with animated GIFs and Google Map)
Report for July 6 Grundy and Tama counties (PDF)