
With the 2015 Iowa Legislature now in session, it’s a good time to look into the maps and composition of district control. Republicans control the House 56-43 (pending one election in the west), and Democrats hold the slimmest edge in the Senate, 26-24.
First, a map without lines. (All of these are based off the Legislative Services Agency.)

This is 13 districts’ worth of representation in the Senate, all in Republican hands, comprising about half of Iowa’s land area. The east border runs from Lynnville and Lineville around Des Moines’ suburbs to Randall and then north to Lake Mills. Excluded are two holes on the west side: One is held by Republican Rick Bertrand in Sioux City, a Senate district with two House Democrats, and the other one is Majority Leader Michael Gronstal’s. Gronstal is the only Senate Democrat whose district lies completely west of I-35.
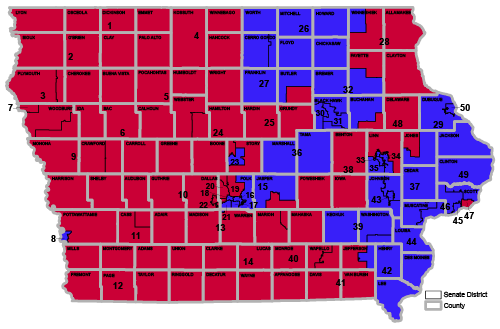
When you bring the rest of the state back in, here’s what it looks like, first by Senate district lines only, then with counties superimposed. (Election maps with results are still available on KCRG’s website. You can also zoom to street level maps from the LSA.)
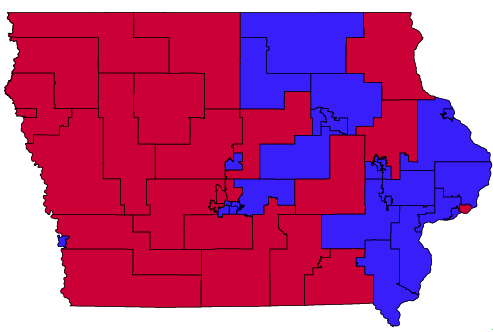
The highway divisor in this one: There’s only one Republican wholly east of counties on and along the US 151/218 line from Dubuque to Cedar Rapids to Keokuk.
Using numbers sent to me by the LSA shortly after redistricting was done, here are distinctions by size and party for the 2015 Legislature*:
- House Republicans have nearly 85% of the state’s land area.
- Senate Republicans have nearly two-thirds of the state’s land area.
- Of 29 House districts over 1100 square miles, Republicans have 26.
- Of 23 House districts under 26 square miles, Democrats have 21.
- Of 11 Senate districts over 2000 square miles, Republicans have 10.
- Of 11 Senate districts under 50 square miles, Democrats have 9.
- There are only three Senate districts between 50 and 110 square miles in size, and only nine between 110 and 1100 square miles.
There are 36 counties — really 34 plus Council Bluffs plus Cumming — partially or entirely in Senate Democratic territory, and six of those are Mary Jo Wilhelm’s in northern Iowa.
By one metric, Wilhelm has one of the most rural Democratic districts; District 26’s largest city is Charles City (7652). For Tod Bowman in District 29, his largest city is Maquoketa (6141). Theirs are the only two of 26 Democratic Senate districts that don’t have all or part of a city with a population of 9500 or greater. Conversely, just seven of 24 Republican Senate districts contain all or part of a city above 26,000 — including Hubert Houser holding the very east end of Council Bluffs — and three of those are exclusively Des Moines suburbs.
In other words, I just dropped three maps and a whole bunch of numbers to reinforce what everyone understood already: Democrats predominate in Iowa’s urban areas, and Republicans in the spread-out and shrinking rural areas.
When you look at the maps this way, it becomes evident that despite Iowa’s independent redistricting process, there may be few truly flippable Senate districts. The ones to look at are those that pair a rural House district with another House district based around a small or medium Iowa city. District 5 with Fort Dodge, the one Democrat Daryl Beall was ousted from, would be an example (and really, the one that makes this map exercise possible).
With such similarities between members of each party and characteristics of their districts, the rural-urban split may get lost in general partisan attitudes. It might flare up in debate over the gas tax, or limits on when school can start.
*These statistics make the assumption a Republican will win the House special election to fill the seat vacated after its occupant won the race for Joni Ernst’s Senate seat. If that doesn’t happen, I will revise accordingly.