UPDATE 9/20/21: After the official 2020 census numbers came out … it didn’t.
========================
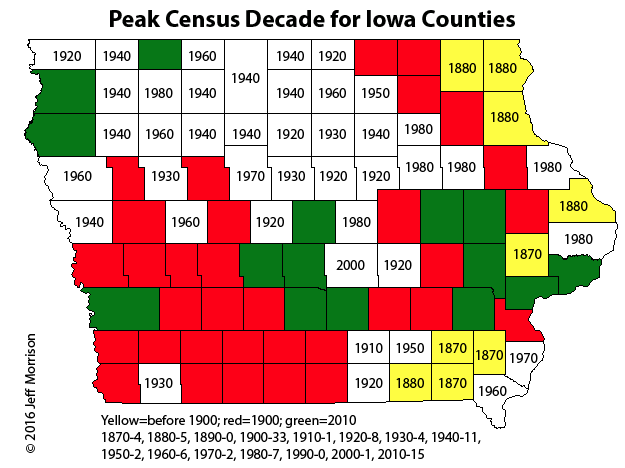
To dig into the 2016 county population estimates, let’s start with the map I made last year.

The pattern hasn’t changed much: Every decade, the urban counties hit a peak — except that some in northeast Iowa topped out in 1980 — and a big lump of rural counties get farther away from the totals they had a century or more ago.
But in census estimates released last week (numbers obtained via the federal site, because the Iowa State Data Center’s bells-and-whistles website is nigh unusable), an exception arose.
Jefferson County passed 18,000 people and its 1870 peak of 17,839 last year, according to the census estimates. In fact, the re-evaluated yearly estimates put the record first in 2015.
Both the 1880 and 1900 censuses weren’t that far off from 1870’s, but there was enough of a dip afterward that Jefferson County languished below its high until now. It must be all the yogic flying in Fairfield and Maharishi Vedic City. (But seriously, the unique culture there is probably the main driver, seeing as though Libertyville school is closing this year.)
Statewide otherwise, the numbers are same-ol-same-ol:
- Since 2010, Polk, Dallas, Johnson, and Linn counties are estimated to have added 87,886 people. The rest of the state combined has a net gain of 452 — and of those 95 counties, only 23 are on the plus side.
- In the one-year estimate (7/1/15-7/1/16), those four counties gained nearly 15,000 people while the other 95 lost 2249.
- 39 counties lost less than 100 people in a year, so it’s not horrible…
- …until you see that all but six of those 39 have lost more than 100 since the last official census. (And one of the six is Dubuque, whose 2010-16 overall gain is 3350, making it a huge outlier.)
