First in a series.
The Census Bureau released its 2017 county-level population estimates in April. It’s not a full decade, but it is seven data points, and the trend for rural counties may be even worse than it was.
The following statistics come from the Census Bureau’s final yearly intradecade percentage growth estimates for the 1990s and 2000s, and the 2017 data used for the 2010s. (Fortunately, the last was easy to obtain from the Census Bureau; the Iowa State Data Center has been next to useless for raw data since the decade began.) All years are fiscal (starting July 1 of the preceding calendar year).
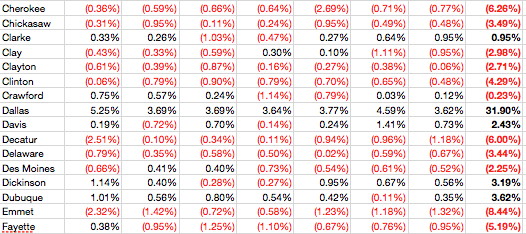
While Dallas County keeps winning (more on that in another blog post), much of the rest of the state loses…and loses…and loses. Here’s a sample of what it looks like for 2011-17 (with decade bolded at end), with Dallas County’s absurdities in the center row.

Most of those losses are below 1 percent, but that isn’t a salve. If you are, say, a county of 14,000 people in 1990 and lose an average of three-quarters of 1 percent a year for 20 years, then you become a county of 12,000 people. And if you’re still losing, 11,000 is getting closer than you’d like. You are, in fact, Cherokee County. Cherokee County has been on a once-interrupted losing streak for more than a quarter-century, losing 2700 people, or nearly 20 percent, since 1990. (That interruption was the April 2010 hard count vs. the July 2009 estimate, a nine-month period that in a sense reset the projections.)
In the 1990s, only three counties never had an estimated increase, while six more only had one. In the 2000s, that jumped: 12 never grew, and 13 only grew once. In the 2010s so far, a whopping 21 counties have never had an increase, and 25 more have only one positive year. There’s still time for those last two numbers to shrink, but not much.
The 1980s dip in real population, not just a lower percentage growth, has had repercussions to this day. To think about it compound interest-wise: If, starting with the 1980 census, the state as a whole grew by 1% a year, Iowa would have had 4,210,675 people in 2017 —likely good for six U.S. House members. At HALF a percent a year, it would be 3.5 million. Even if we moved that baseline forward, from the 2000 census, 1% growth would have led to about 3.47 million in 2017, and half a percent, a bit under 3.19 million.
But none of that came true. Instead, Iowa in 2017 had an estimate of around 3.146 million — an average 0.28% increase per year over a 27-year period, or 0.46% per year in a seven-year period starting in 2010.
In the first half of the 2010s, North Carolina grew a total of 4.3%, South Carolina grew 4.5%. Utah and its comparatively smaller 1.72% average growth rate this decade will be enough to pass Iowa even sooner than I thought should its gangbusters 2016 and 2017 numbers hold up.
