
Mock 15: Checking Wasserman
The great thing about Iowa’s congressional districts is that anyone can play. I did some looking at what the “professionals” were playing with. I made Mock 15 based on this tweet from Dave Wasserman of the Cook Political Report, and immediately noticed an issue: There’s a variance of more than 1000 between the 1st and 2nd districts. I’ve already done better than that — twice — and in fact I don’t go forward with any simulation that exceeds 1000 in variance.
I do not think the map that won Wasserman’s redistricting challenge would fly with the LSA. Its overall variance of 5 is outweighed by the exceptionally jagged outline of the 2nd District and the way the 4th wraps around the 3rd.
(Mock 18 was also related to the maps in the tweet thread, and it had an overall variance of 513, not bad at all.)
Mock 16: Busting out along US 30
I got two pretty decent districts, but I busted hard on the Benton-Linn-Cedar-Scott area. I mentioned this as a pitfall when I was working with previous estimates in Mock 3. Once a new 3rd goes from Des Moines to the Missouri border, everything left in the bottom tiers has to pour into a new 2nd, and their aggregate is enough for a map to get a Whammy once I reach the US 30 or I-80 corridors.
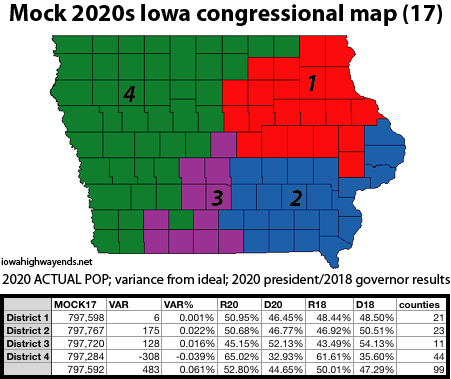
Mock 17: The Creston curl
1st District: LOOK AT THAT 1ST DISTRICT. IT’S SO PRETTY. Sadly, it cannot be combined with my 3rd District from Mock 13, also with a single-digit variance, because everything southeast of them makes a too-big 2nd.
2nd District: A pretty good, decently competitive district with nice lines.
3rd District: What otherwise could be an exceptionally tidy district focused on the Des Moines metro — and one of my few mocks that doesn’t make Story County hate me — hiccups at Union County, which is bigger than its neighbors. Thus, I had to go around the city of Creston by adding three of Iowa’s four smallest counties by population: Adams, Ringgold, and Taylor. That’s this map’s weakness — a one-county-wide section leading to two above and four below isn’t ideal.
4th District: A sprawler containing nearly half the counties in the state.
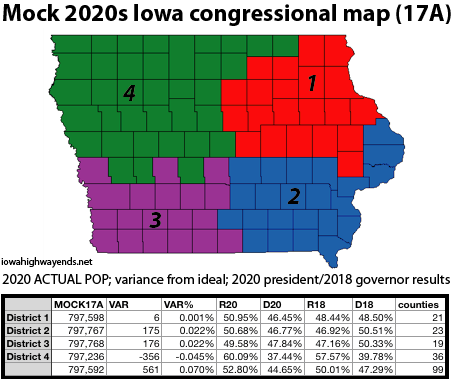
Mock 17A: The Hubbell-Trump map
I love the previous map’s 1st, but it also locks everything northeast of Washington County into the 2nd, and that’s a big chunk of population. This limits possibilities to the west. However, by throwing Story County back in with northwest Iowa again, I got a map that is roughly the same variance-wise, but much more balanced area-wise.
This is an insanely politically competitive map. In all but the 4th, the candidates in the last two statewide elections fell between 46% and 51% of the total vote in these particular county combinations. In fact, 2018 Democratic candidate for governor Fred Hubbell comes out ahead of Gov. Kim Reynolds in three districts — but all three also went for Donald Trump over Joe Biden in 2020.
The 3rd and 4th dovetail with each other, which adds to perimeter but isn’t horrible on compactness. (Shelby County is 1100 people bigger than Guthrie, not much but enough to spill over my 1000-variance district threshold.) The much bigger issue is the separation of Dallas and Polk counties. The grouping or splitting of Polk/Story/Dallas and Linn/Johnson will be the deciding factors in the next decade of Iowa’s congressional delegation.
Mock 19: Self-imposed bust
The individual districts were fine, but the margin between the biggest and smallest was about 1200. As noted above, I didn’t follow through.
UPDATE 9/22: Fixed slight Scott County population error.